
Analyze Transaction Metrics Using the Basic Report
Applies to: Maxio Core
Last updated on Sep 19, 2026
Use the Basic Report to generate analytics information about Transactions. The Basic Report performs computations on the amount, MRR/ARR (normalized amount), quantity, and other data based on the selection of filters such as Item Groups, Registers, and direct field filters. While the Basic Report can compute the Revenues and invoice line items from the selected Transaction, keep in mind that this report was not designed for financial reporting.
Using the Basic Report
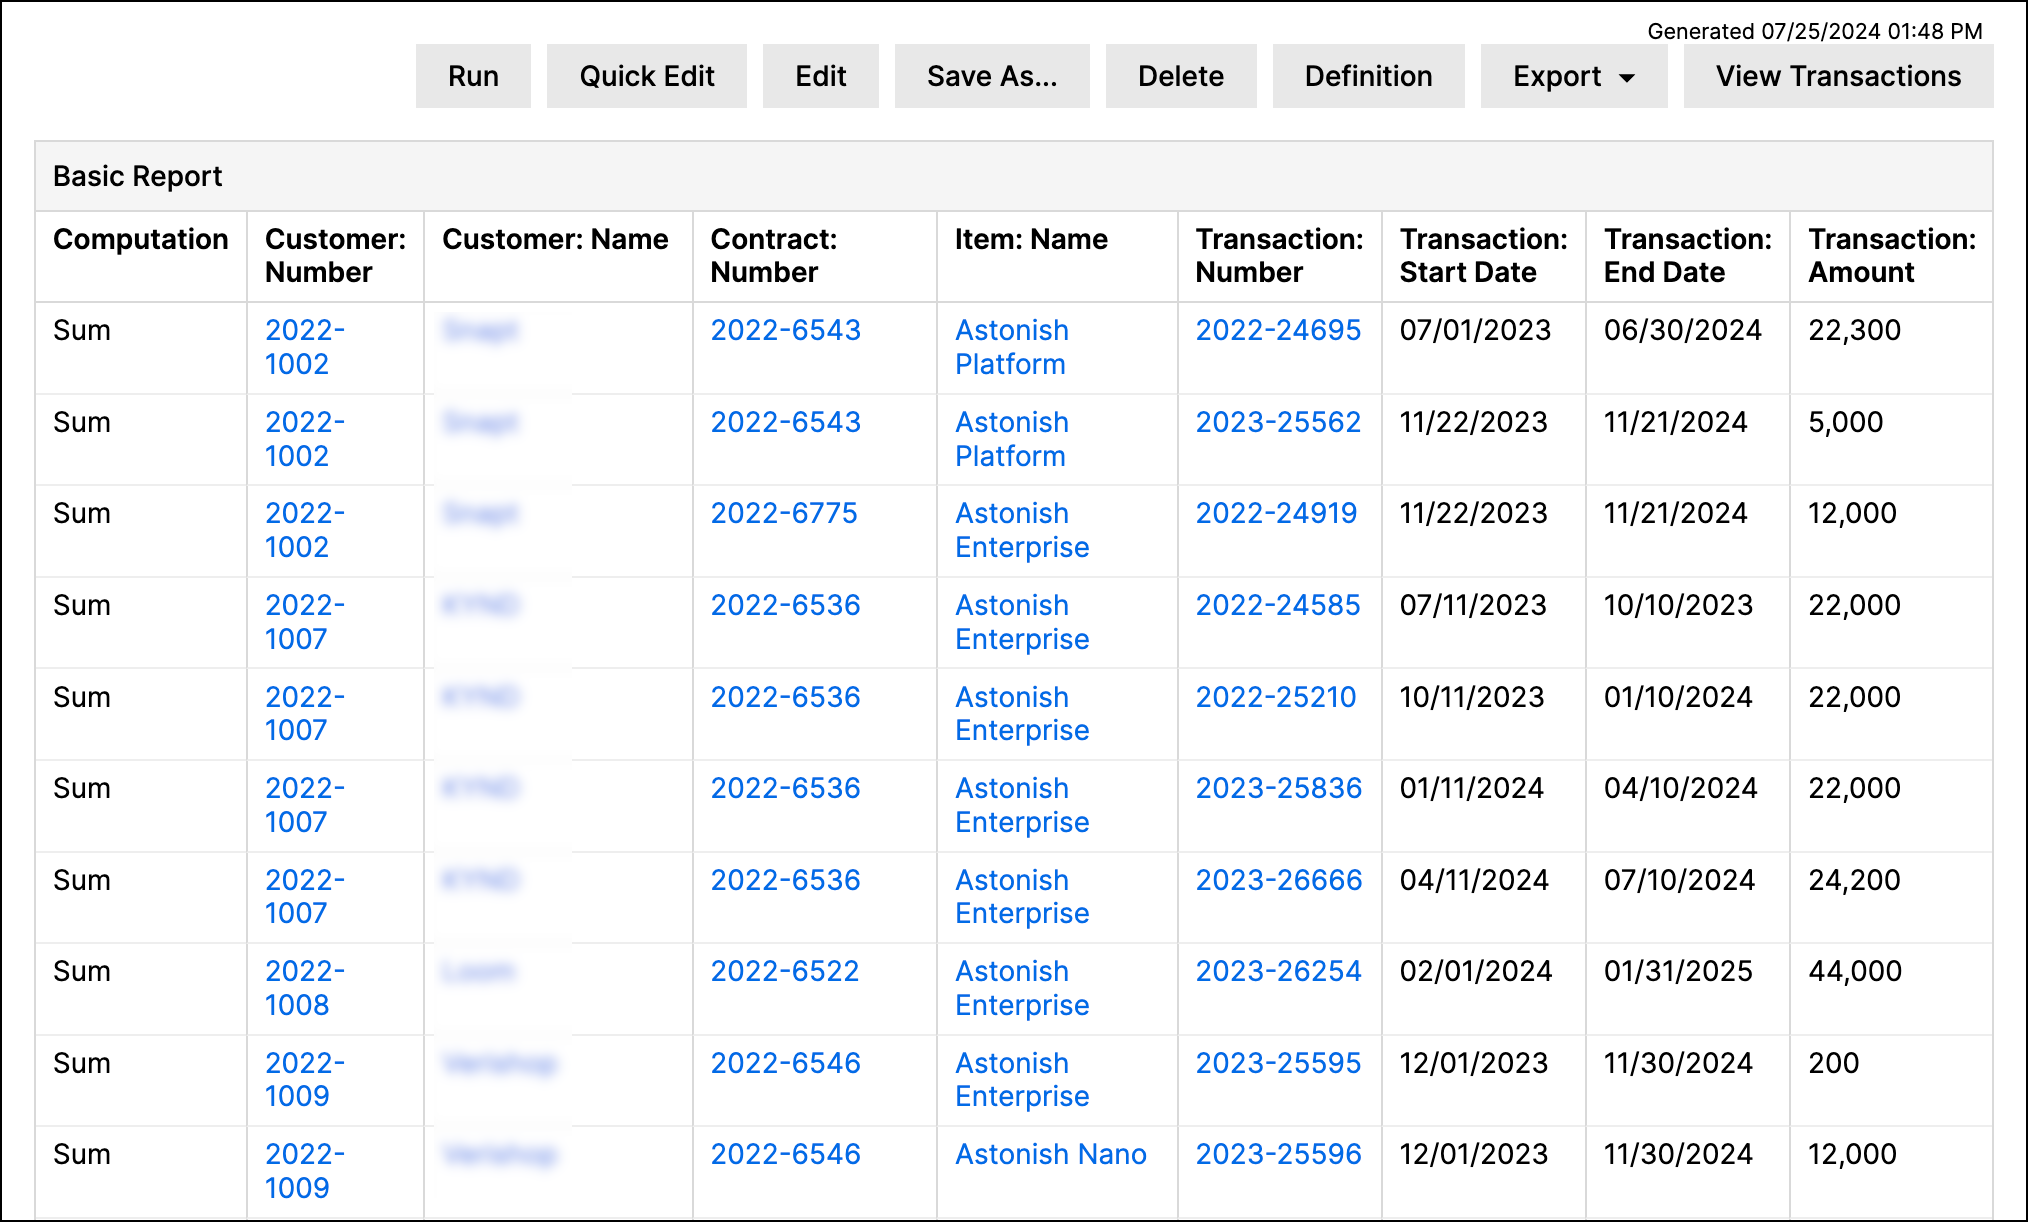
The Basic Report is the most simple report in Maxio Platform as it does not perform any advanced calculations or show changes to data over time. The report simply lists Transaction data in a table for certain periods of time. The examples below only discuss the configurations necessary to generate the discussed metrics. You can find a full glossary of all of the available configuration settings at the bottom of this article.
List of transactions
One of the most common uses of the Basic Report is to simply generate a table of Transactions for a specified period of time. Creating this type of report mostly involves selecting the time frame you want to view using the column settings. Note you can also use the row settings to add additional details (such as MRR/ARR) to the report.
Invoicing and revenue schedule
The Basic Report is the only report that allows you to view invoicing and the Revenue Schedule at the Transaction level.
Cohort reporting with the Basic Report
You should use the Analyzing Customers Using the Cohort Report for full cohort reporting. However, the Basic Report does allow you to view Transaction-level cohort metrics, such as the ARR brought in from a certain industry.
Determine sales commissions
Maxio Platform does not currently provide a report specifically for commissions. However, you can use the Basic Report to gather the initial information necessary to determine sales commissions, such as ARR by sales rep.
Notes and caveats
The following are limitations of this report:
- When the Include Invoices option is enabled, the report only reports on invoice line items that are linked to Transactions. An invoice line item without a link is excluded from the report by definition.
- Invoice line items included with Include Invoices are based on the associated Transaction's item, not the invoice line item's own item. Example: a Transaction uses item "Alpha." An invoice line item associated with that Transaction has a different item, "Beta." If you run this report for the "Alpha" item, the invoice line item is included. If you run the report for the "Beta" item, the invoice line item is not included.
- You cannot run this report by account.
- This report includes Revenues for Transactions that have Do Not Recognize enabled, even Revenues that finance reports exclude.
- The Basic Report produces one row per computation at the most granular level of records selected. The more granular you get with the Additional Details section, the more rows you see.
Configuration glossary
Use the settings below when building a Basic Report.
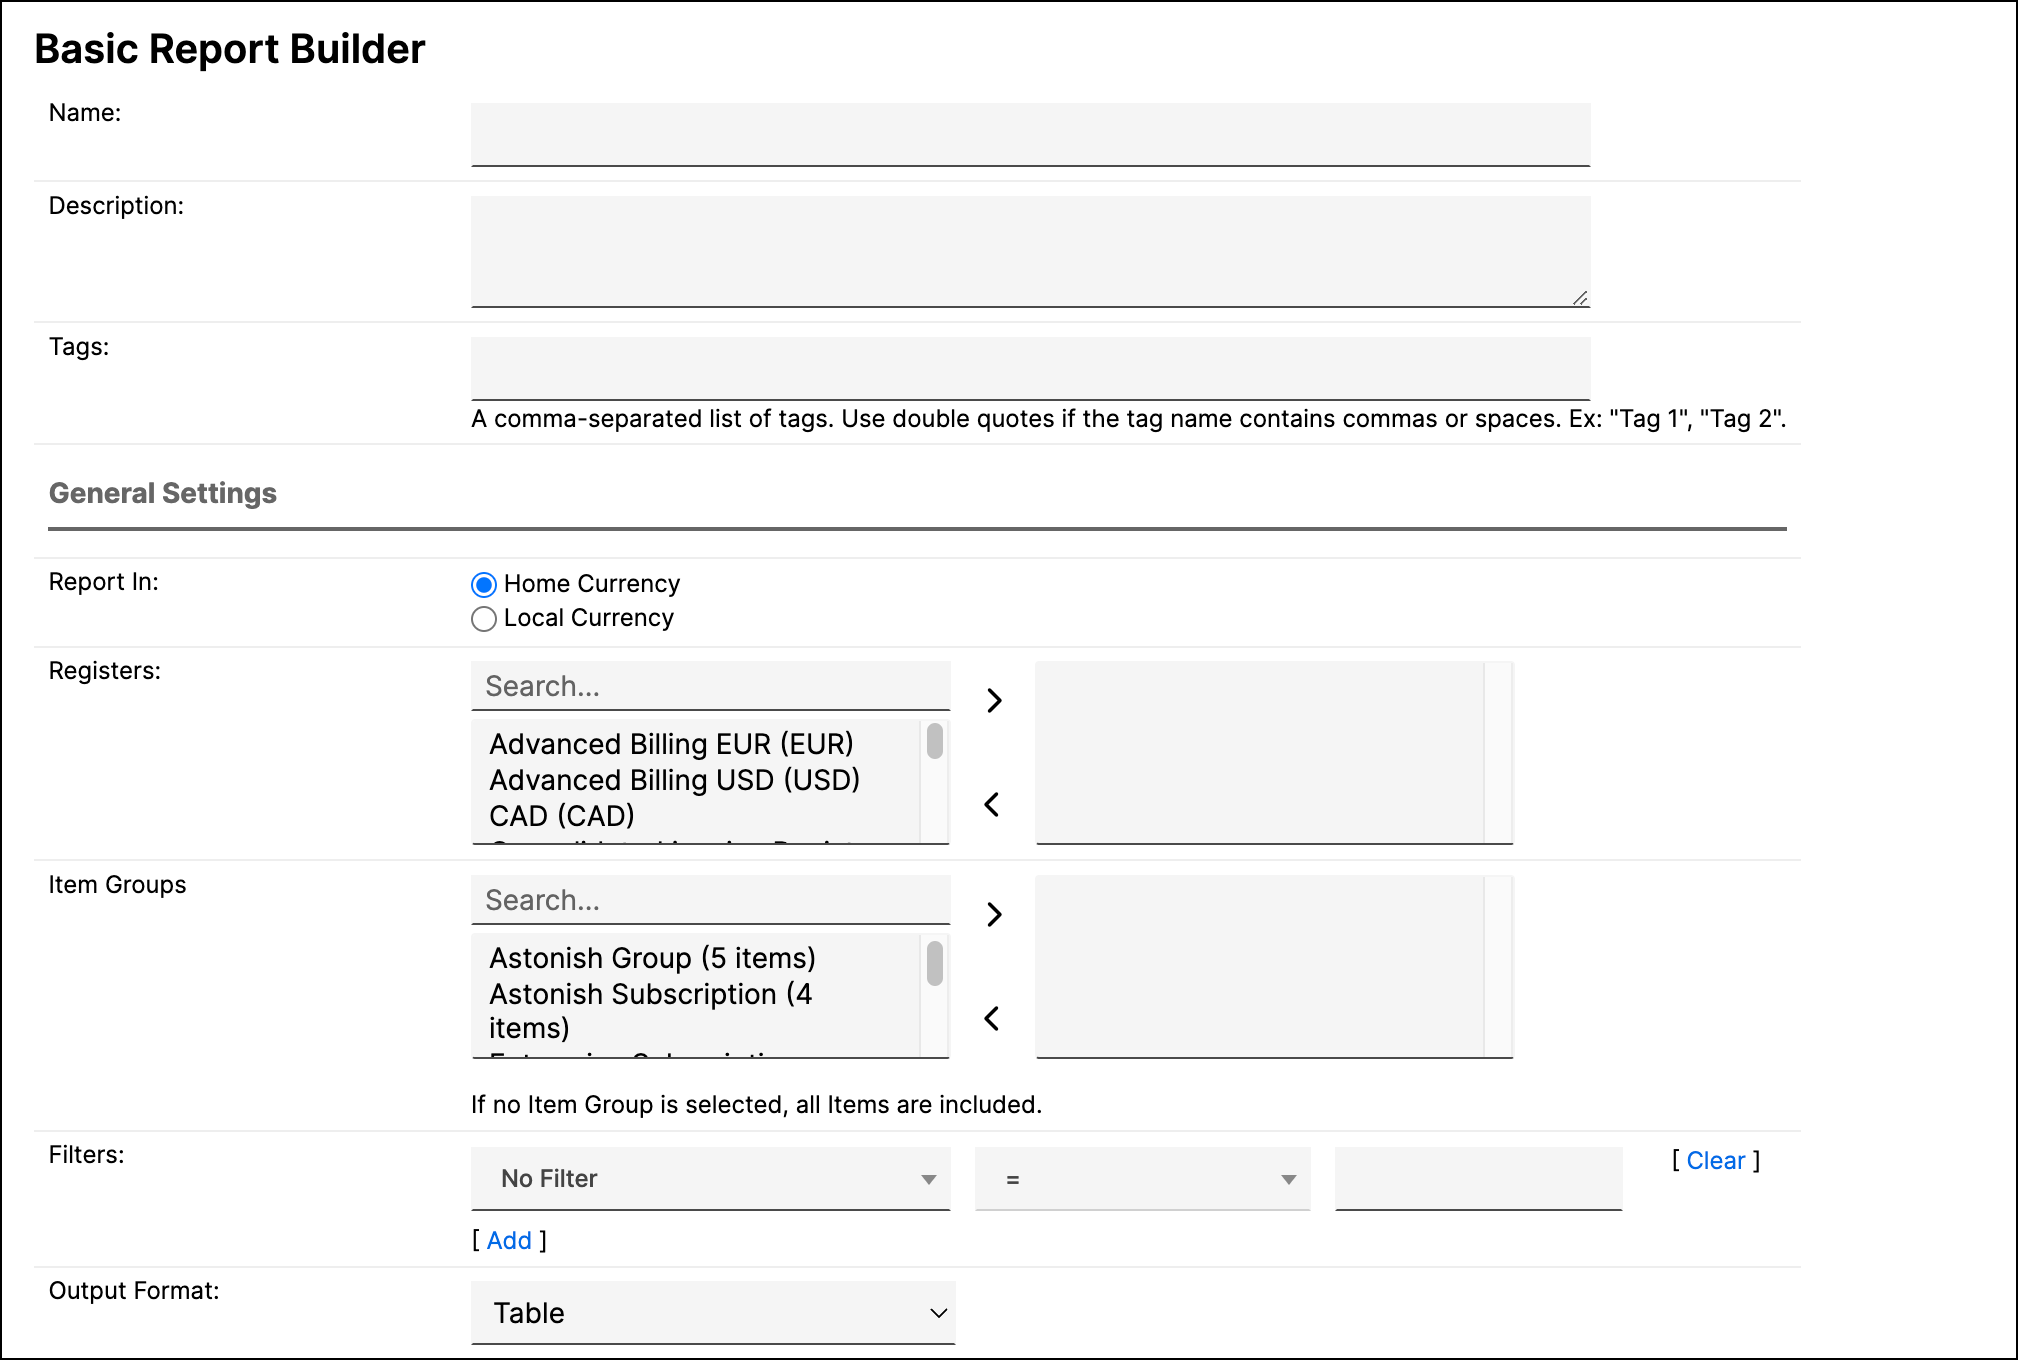
General settings
| Setting | Description |
|---|---|
| Currency Presentation | This option appears only if multi-currency is enabled in your account. Choose Home Currency to report across Registers that use different currencies, or Local Currency if all selected Registers use the same currency. |
| Registers | Select one or more Registers from which Transactions are to be included. If no Register is selected, all are included. |
| Item Groups | Select the Create and Use Item Groups to be included in the report. If no Item Group is selected, all Items are included. |
| Item Type | Choose whether to include Recurring Only, All, or Non-Recurring Only Items in the report. |
| Output Format | Choose whether the report displays as a Table or a Chart. Charts are unavailable for reports that include Item Groups. |
| Filters | Select one or more filters and appropriate matching criteria to filter in or out relevant Transactions. All filters are applied together, so results must match every filter. See Create and Manage Reports for more on filtering options. |
Row settings
| Setting | Description |
|---|---|
| Compute | Select the computations to include in the report.
|
| of Transaction | Select the Transaction field or property to use in computations. Any numeric custom fields on the Transaction also appear here as additional choices. See the Transaction Field Reference for an explanation of the individual fields. |
| Carry Value Across Active Periods | Carries a Transaction's value forward into each active period it spans, instead of reporting it only in its starting period. |
| Include Revenue | In addition to the computations chosen, also display a sum of the Revenues associated with the Transactions included in the report. Like the computations, you see one revenue row per most-granular level of records chosen. |
| Include Invoices | In addition to the computations chosen, also display a sum of the invoice line items associated with the Transactions included in the report. Like the computations, you see one invoices row per the most granular level of records chosen. The logic first gets the Transactions that meet the report criteria, then returns the total of the invoice line items for those Transactions. In other words, the report does not simply get the invoices for a period of time. Example: a Transaction has a Start Date of Jan 1, 2020, an End Date of June 30, 2020, and an Invoice Date of July 1, 2020 (in arrears). |
Report results depend on which date range includes the Invoice Date
| Report 1 | Report 2 | Report 3 |
|---|---|---|
| Uses Start Date, date range Jan 2020 through June 2020. Result: the invoice is not included in the report results. The Transaction's Start Date of Jan 1, 2020 is in the date range, but the Invoice Date of July 1, 2020 is not, so it does not display. | Uses Start Date, date range July 2020 through Dec 2020. Result: the invoice is not included in the report results. The Invoice Date of July 1, 2020 is in the date range, but the Transaction's Start Date of January 1, 2020 is not, so it does not display. The Basic Report first finds the Transactions that match the criteria, then filters on invoice dates. | Uses Start Date, date range Jan 2020 through July 2020. Result: the invoice is included in the report results. The Transaction's Start Date of January 1, 2020 and the Invoice Date of July 1 are both in the range. |
| Setting | Description |
|---|---|
| Additional Details | Select additional fields to include. As stated above, the report produces one row per the most granular level of detail. For example, if Customer Name were the only additional detail selected, you see one row per computation per customer. If you also included Transaction Number, you see more rows: one row per computation per transaction (with the Customer Name included for reference). |
| View Order | Determines which column has its values grouped together first in the results: Item Group, Computation, or Additional Details. |
| Totals | Choose whether to add a Totals row, and whether to also show percentages, when only one computation is selected. |
| Show Column Change Percentage | Display the percent change between reporting periods. |
| Show Total Row Percentage | For each row, display the percentage of the full reporting period that each reporting period accounts for. |
| Show Decimals | Display computed values with decimal precision. |
| Freeze Left Column | Keep the leftmost column visible while scrolling horizontally through the report results. |
| Freeze Header Row | Keep the header row visible while scrolling vertically through the report results. |
Column settings
| Setting | Description |
|---|---|
| Report By |
|
| Select Transactions By | Transactions have 3 standard date fields. Select the one the date range should use. Use Order Date with caution, since it is not a required field on Transactions. If you select Order Date, only Transactions with an Order Date are included. |
| Date Range | Select fixed custom dates or one of the date range options. |
| Periodicity | Columns appear for each of the following periods within the date range specified above.
|
| Future Periods | Select this checkbox to add a column after the Total column. This column displays the total value of the computation for each report row for all Transactions with a date or term number later than the end of the selected range. Only available when Report By is set to Time Period. |
Advanced settings
| Setting | Description |
|---|---|
| Unrecognizable Revenue | This option applies only to the Revenue computation. It relates to the Transaction-level Recognize - Include in Finance Reports checkbox. Unrecognizable revenue can occur when an open acceptance or another issue prevents the recognition of a Transaction's associated Revenues.
|
Related information
To use a Basic Report as a reusable, one-click starting point, see Fast Start with One-Click Reports.
If the Basic Report doesn't fit your metric, see Choose the Right Report for Your Metric to find one that does.
Still need help?
Reach out and our support team will take it from here.